
UCITS ETFs from India: What They Are, and Why They're Now on INDmoney
Here’s a number worth sitting with: a Nifty 50 index fund has delivered 6.90% a year over the last 5 years. The same money, in an S&P 500 fund, delivered close to double that — whether you accessed it through a US-listed ETF or, now, through a UCITS ETF right from your INDmoney account in India.
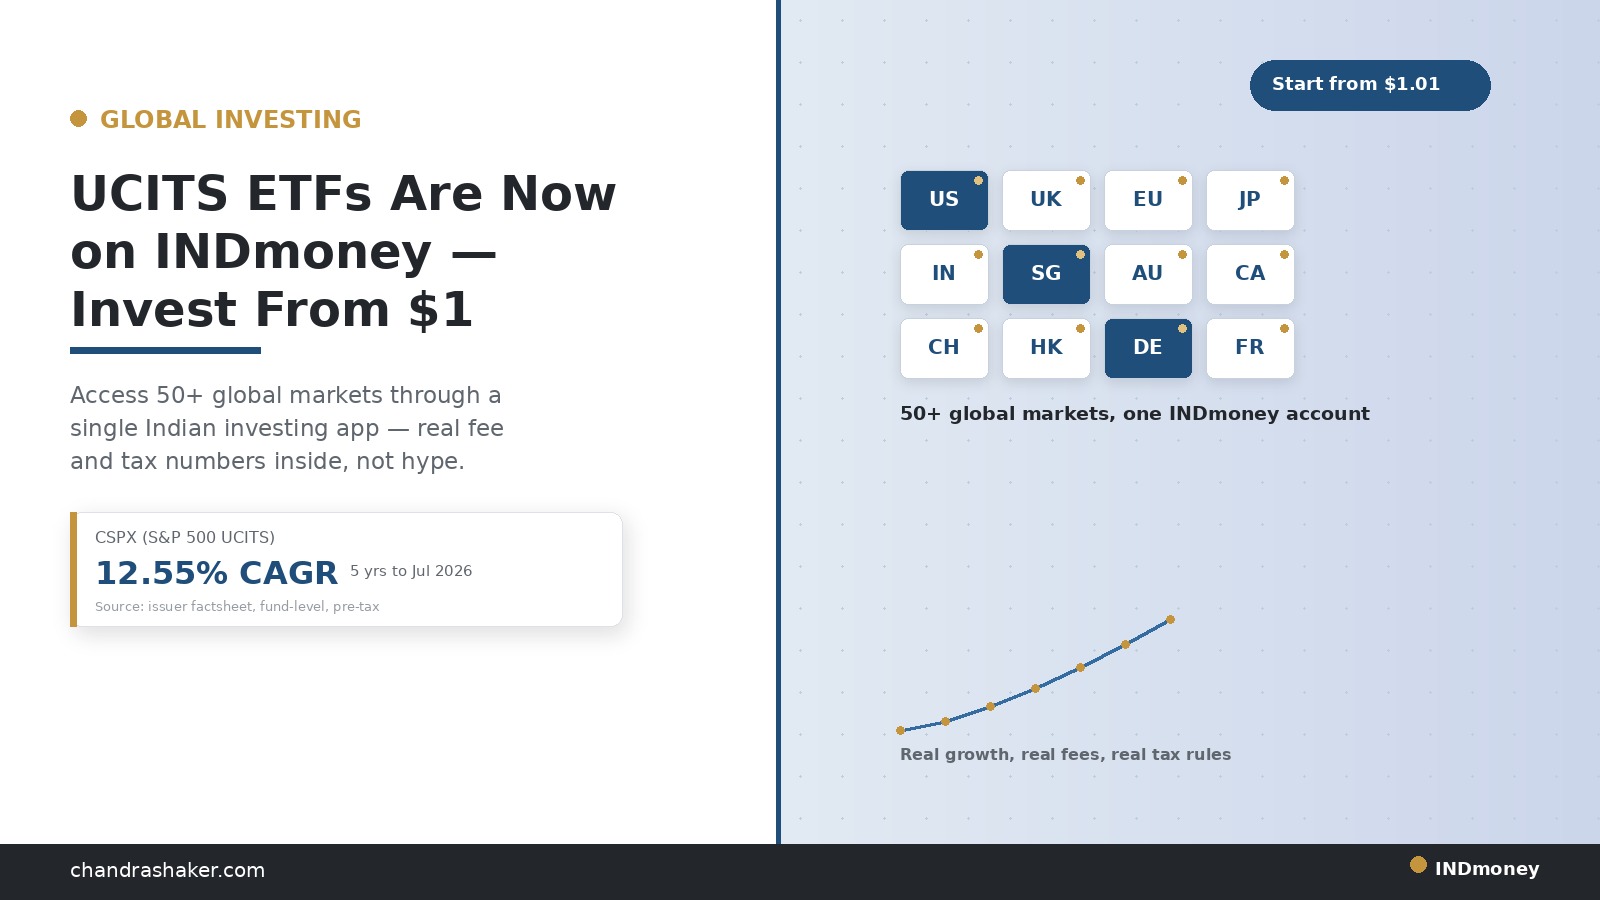
That’s not a sales pitch — it’s what the actual, published 5-year numbers show, and it’s exactly why UCITS ETFs matter for Indian investors right now. Until recently, reaching that US exposure meant a US brokerage account. Now, INDmoney has opened up UCITS ETFs — European-domiciled funds that give Indian investors access to over 50 global markets, including the S&P 500, through the same app already used for US stocks, with fractional investing starting from as little as $1.01.
This post walks through what UCITS actually means, the real fee and return numbers for India vs. US-listed vs. UCITS (not marketing figures), a worked example, and exactly where UCITS fits if you’re already investing in US stocks from India.
India vs US-listed vs UCITS: the real numbers, side by side
Before getting into definitions, here’s the actual comparison that matters — what each route has delivered, and what each actually costs.
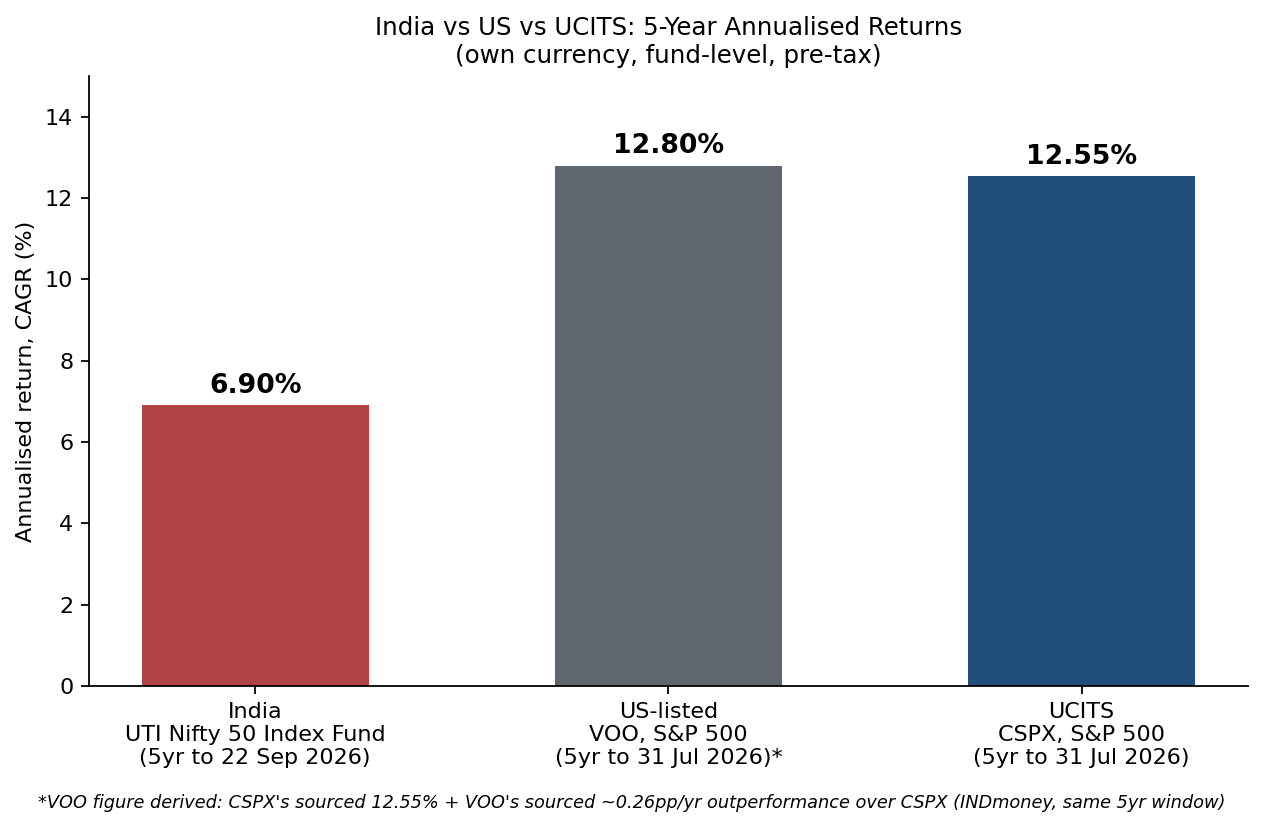
All three funds’ returns are shown in their own currency, fund-level, before tax — a Nifty 50 index fund’s 6.90% (5 years to 22 September 2026, per Value Research) sits well below both S&P 500 routes, VOO’s ~12.80%* and CSPX’s 12.55% (both 5 years to 31 July 2026). *The VOO figure is derived, not independently published: it’s CSPX’s own sourced 12.55% plus VOO’s separately-sourced ~0.26 percentage-point/year outperformance over CSPX across the same window — shown transparently rather than presented as an independently issued number.
Fees tell a different story:
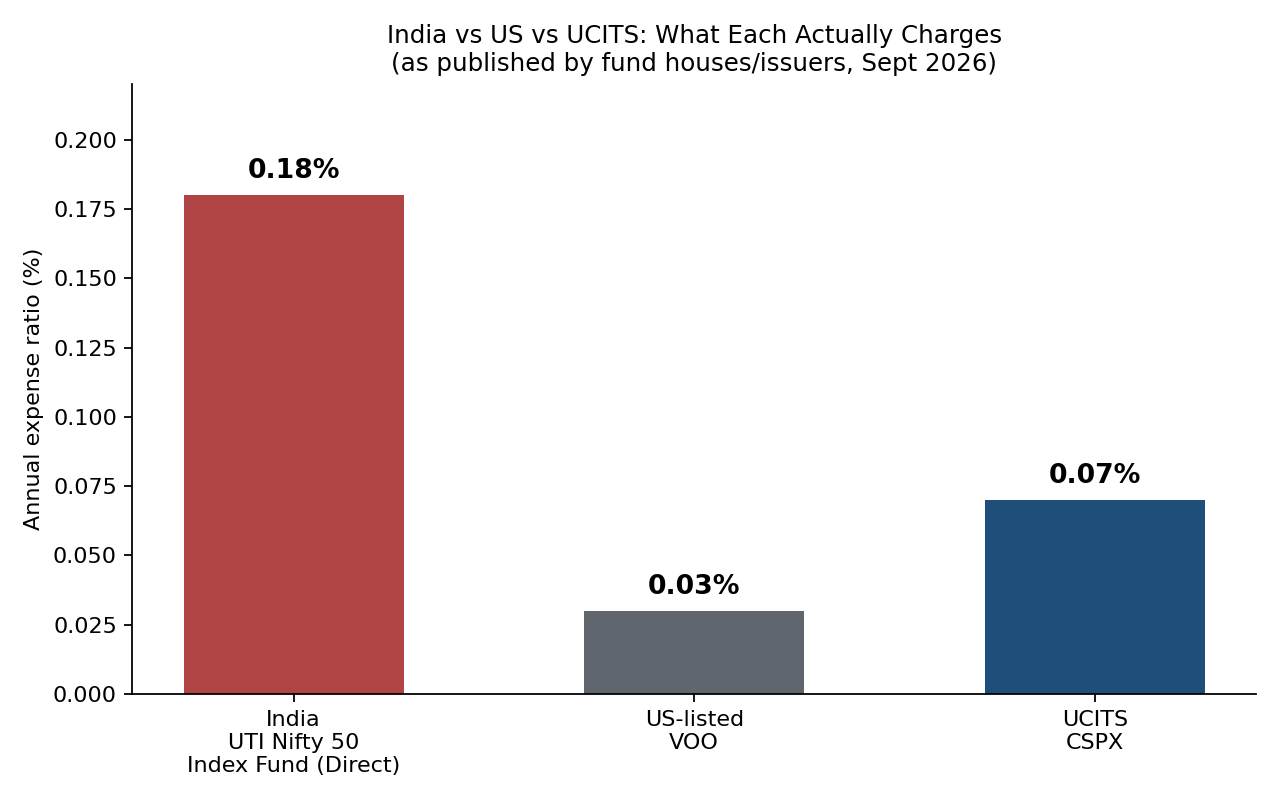
A Nifty 50 index fund’s Direct-plan expense ratio (0.18%) is actually the highest of the three — more than double CSPX’s 0.07%, and six times VOO’s 0.03%. (For reference: UTI also runs a Nifty 50 ETF, not an index fund, at a 0.07% expense ratio — the same figure as CSPX, coincidentally, though that ETF still only gives Indian-market exposure.)
A worked example: ₹10 lakh, 5 years, three routes
Using each fund’s own actual historical CAGR (not a projection) purely to illustrate the scale of the gap:
| Route | 5-yr CAGR | ₹10,00,000 becomes… |
|---|---|---|
| Nifty 50 Index Fund (India) | 6.90% | ₹13,96,000 |
| VOO (US-listed S&P 500)* | ~12.80% | ~₹18,26,000 (in USD terms, pre-conversion) |
| CSPX (UCITS S&P 500) | 12.55% | ₹18,06,000 (in USD terms, pre-conversion) |
This is historical fact, not a forecast — past 5-year performance doesn’t predict the next 5 years, for any of the three. The US-exposure figures are also shown in their own currency before conversion; currency movement is a separate, real effect layered on top (see below), and it can work for or against an Indian investor depending on direction.
What does “UCITS” actually mean?
UCITS stands for Undertakings for Collective Investment in Transferable Securities — a European Commission regulatory framework for funds sold across Europe. In practice, a “UCITS ETF” is an exchange-traded fund domiciled in a European jurisdiction (most commonly Ireland or Luxembourg) and regulated under this framework, rather than domiciled in the US under US securities law.
The distinction matters because domicile changes the tax and legal treatment of the fund itself — not the market it tracks. A UCITS S&P 500 fund and a US-listed S&P 500 ETF can hold nearly identical underlying stocks, but the wrapper around them is legally and fiscally different.
A listing is not the same as a domicile. This trips a lot of investors up. The popular iShares Core S&P 500 UCITS ETF (ISIN IE00B5BMR087) is domiciled in Ireland, but it trades as CSPX in USD on the London Stock Exchange, as CSP1 in GBP also on the LSE, and under other tickers on continental European exchanges. It’s the same Ireland-domiciled fund regardless of which exchange or currency you buy it through — a USD listing doesn’t make it a US asset.
On INDmoney specifically, UCITS ETFs are accessed through their London Stock Exchange listings.
What’s actually different: fees, tax, and access
The fee gap is real, but small in absolute terms
Comparing the same index, tracked by both a UCITS fund and a US-listed fund: CSPX (the Ireland-domiciled S&P 500 UCITS ETF) carries a 0.07% expense ratio, while VOO (Vanguard’s US-listed S&P 500 ETF) charges 0.03%, as of September 2026 — the three-way chart above already shows where India’s own index-fund fees sit by comparison. On a ₹10 lakh position, CSPX’s fee works out to roughly ₹700 a year versus VOO’s ₹300 — a ₹400 difference. Small in isolation, but it compounds over long holding periods, and it’s still the cheapest of the three options once India’s 0.18% is factored in.
That fee gap alone doesn’t decide which is better. It’s one input among several — tracking difference, dividend withholding, spreads, and your own tax situation all matter too.
Accumulating share classes change how dividends are handled
Many UCITS ETFs (CSPX included) are accumulating funds — instead of paying out dividends in cash, the fund reinvests them internally, so the dividend income is baked into the unit price rather than showing up as a payout. This is different from most US-listed ETFs like VOO, which distribute income quarterly.
For a long-term investor who was going to reinvest dividends anyway, an accumulating share class removes a manual step. But it doesn’t eliminate tax — you still owe Indian capital gains tax when you eventually sell, and the fund can still face dividend withholding tax internally on the underlying holdings before it ever reaches you, which is a genuinely different mechanism from the withholding tax on a US-listed ETF’s distributions.
Tax treatment for the Indian investor
UCITS ETF units are foreign securities, not listed on an Indian exchange, so they follow the same broad tax treatment as US stocks held from India:
- Held 24 months or less: short-term gains, taxed at your income tax slab rate
- Held more than 24 months: long-term gains, taxed at 12.5% without indexation
Schedule FA disclosure is mandatory — foreign assets must be reported in Schedule FA of your ITR for every year you hold them, even in years the fund pays no visible income and even for accumulating funds that never distribute cash. This is a genuine compliance step, not optional paperwork, and it applies whether the fund is up, down, or flat that year.
Access and minimum investment
On INDmoney, UCITS ETFs support fractional investing in most cases — you can start with as little as $1.01. The platform’s UCITS catalog spans over 50 global markets, including more than 30 countries with dedicated single-country ETFs, alongside broad global funds like MSCI World or MSCI ACWI that span dozens of countries in a single trade.
That breadth is the genuine advantage UCITS has over the US-listed route: access to European, Asian, and other regional markets that simply aren’t available as US-listed ETFs at all.
UCITS vs. US-listed ETFs: the real comparison
| UCITS ETFs | US-Listed ETFs | |
|---|---|---|
| Domicile | Ireland, Luxembourg (Europe) | United States |
| Access on INDmoney | Via London Stock Exchange | Direct US exchange |
| Typical fees | Slightly higher (e.g., CSPX: 0.07%) | Often lower (e.g., VOO: 0.03%) |
| Product breadth | Narrower — core index funds, fewer niche/leveraged products | Much broader — sector, leveraged, options-based, active funds |
| Market access | 50+ global markets, many single-country options | Primarily US-listed exposure |
| Dividend handling | Many accumulating (auto-reinvested) | Mostly distributing (quarterly payouts) |
| Indian tax treatment | Same as US stocks: 12.5% LTCG after 24 months | Same: 12.5% LTCG after 24 months |
| Schedule FA reporting | Required | Required |
The honest answer on “which is better”: UCITS doesn’t automatically outperform, and a lower expense ratio doesn’t automatically win either. In one real comparison, Vanguard’s VOO actually outperformed CSPX by roughly 0.25–0.27 percentage points a year over 1, 3, and 5-year periods ending mid-2026 — even though both track the same S&P 500 index. The gap came from a combination of dividend withholding, tracking difference, and fund mechanics, not from UCITS being inherently worse. The right comparison is always fund-specific, not wrapper-specific.
12.55% a year in USD terms, over the 5 years ending July 2026 — that’s the issuer’s own published, pre-tax, fund-level figure (the same number shown in the three-way comparison above). It’s not a forecast, and it doesn’t account for currency movement, Indian tax, or your own entry/exit timing — all of which change your actual take-home return. Worth noting too: over that same 5-year window, USD/INR moved from roughly ₹74.34 to ₹95.38, which by itself added meaningfully to the rupee-converted return for an Indian investor holding dollar-denominated assets — a separate effect from the fund’s own performance, and one that can just as easily reverse.
If exposure to global markets — not just the US — is something you’ve been putting off simply because there wasn’t an easy way to do it from India, this is that way. The same INDmoney account that handles US stocks now handles UCITS ETFs too, so it’s a genuine expansion of what you can already do, not a separate signup process.
Who should actually consider UCITS ETFs
- Investors wanting exposure outside the US — European, Asian, or single-country markets that aren’t available as US-listed ETFs at all
- Investors who want simpler dividend handling — an accumulating share class avoids manually reinvesting quarterly payouts
- Investors already comfortable with the US-stocks tax and disclosure process — since Schedule FA reporting and the 24-month LTCG rule are identical to what you’re likely already doing for US stocks
Where the US-listed route still wins: broader product choice (sector funds, leveraged and options-based products, actively managed ETFs), typically lower headline fees on the most popular core index funds, and a route many Indian investors are already more familiar with.
Practical starting point: if your only goal is core global equity exposure (S&P 500, MSCI World), compare the specific fund pair — not the wrapper category — on fees, tracking difference, and dividend treatment before deciding. If your goal is exposure to a market that has no US-listed equivalent, UCITS is often the only practical route.
Why this matters more right now: Indian large-caps have gone nowhere for 2 years
Here’s the context that makes global diversification worth a second look. The Nifty 50 has been essentially flat — and on a pure price basis, actually down — over the last two years:
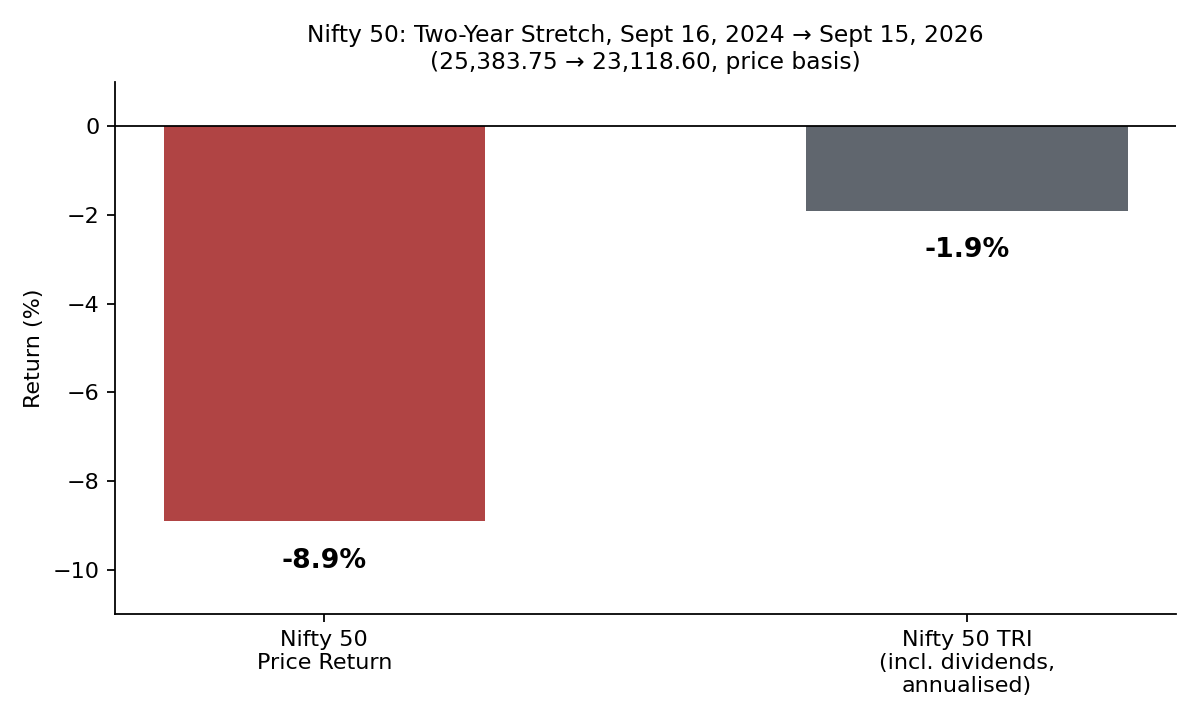
From 25,383.75 on September 16, 2024 to 23,118.60 on September 15, 2026, the Nifty 50 fell 8.9% on a price basis. Including dividends (the Nifty 50 TRI, which is the fairer real-world comparison), the index still delivered a -1.9% annualised return over that same two-year window — a genuine loss in real terms, not just a rounding-error “flat year.” Market commentary this month has described it as the Sensex’s worst two-year stretch since 2012, with indices not making a new all-time high in over 690 days.
One honest caveat, in the interest of not misleading anyone: this isn’t a direct apples-to-apples comparison with CSPX’s 12.55% CAGR figure above — that’s a 5-year window ending July 2026, not the same 2-year window as the Nifty figures. I’m not aware of a precisely matched, verified 2-year S&P 500 return figure for this exact window to place side-by-side, and I’d rather leave that gap honest than force a number that isn’t properly sourced. What the Nifty data does show, on its own and accurately: a portfolio concentrated only in Indian large-caps has been through a genuinely difficult two years — which is a real, current reason geographic diversification is worth considering, separate from any claim about which market will outperform going forward. Nobody can reliably predict that, for India or the US.
Getting started
If you already have an INDmoney account for US stocks — see our complete guide to investing in US stocks from India if you don’t yet — there’s nothing new to set up. UCITS ETFs sit in the same app, under the same account, alongside your existing US holdings. If you’re starting fresh, one account gets you both US-listed ETFs and UCITS ETFs from day one, with fractional investing from $1.01 removing the usual “I need a lot of capital to start” barrier.
I already use INDmoney for global investing and mutual fund SIPs. If broader-than-US exposure — Europe, Asia, or single-country markets you can’t otherwise reach from India — is something you’ve been meaning to look into, this is a reasonable place to actually start, rather than keep putting it off.
(Disclosure: the INDmoney link above is a referral link — I may earn a small commission at no extra cost to you if you sign up through it. Full disclosure on the Disclaimer page.)
FAQ
What does UCITS mean? UCITS stands for Undertakings for Collective Investment in Transferable Securities — a European Commission regulatory framework for funds sold across Europe. A “UCITS ETF” is a fund domiciled in a European jurisdiction like Ireland or Luxembourg under this framework.
Is a UCITS ETF the same as buying on a European exchange? Not exactly — the exchange is just the access point. A UCITS fund can be domiciled in Ireland but listed and traded in USD, GBP, or EUR on multiple exchanges. The domicile, not the listing currency or exchange, determines its legal and tax treatment.
How are UCITS ETFs taxed for Indian investors? The same as US stocks: gains held 24 months or less are short-term, taxed at your slab rate; gains held longer are long-term, taxed at 12.5% without indexation. Schedule FA disclosure is required every year you hold the units.
Are UCITS ETF fees higher than US-listed ETFs? Often slightly, yes — for example CSPX’s 0.07% vs VOO’s 0.03% on the same S&P 500 index. But total return depends on more than the expense ratio alone — tracking difference, dividend withholding, and currency effects all matter too.
What’s the minimum investment for UCITS ETFs on INDmoney? Fractional investing is enabled in most cases, with a minimum as low as $1.01.
Disclaimer
This article is for general educational and informational purposes only and does not constitute personalised investment, financial, or tax advice. I am not a SEBI-registered investment adviser.
On the figures and charts in this post: all fee, return, and growth figures shown (including the 12.55% CAGR and fee-comparison chart) are historical, fund-level, pre-tax numbers as published by the fund issuers and INDmoney as of September 2026. Past performance does not guarantee or indicate future results. These figures do not account for your individual tax situation, currency movement after the date shown, transaction costs, or the timing of your own entry and exit — your actual returns will differ, and could be lower, including a loss of the amount invested.
Investments in foreign securities carry currency risk, market risk, and country-specific regulatory risk, in addition to standard equity market risk. Tax rules, including Schedule FA reporting requirements, are subject to change — verify current rules with the Income Tax Department or a qualified CA before investing. This post is not sponsored by INDmoney; it includes a referral link (disclosed above) which may earn a small commission at no extra cost to you.
Sources: INDmoney: What Are UCITS ETFs?, INDmoney: UCITS ETFs vs US-Listed ETFs, INDmoney: Can UCITS ETFs Give Higher Returns Than US ETFs?, INDmoney: How to Choose a UCITS ETF, INDmoney UCITS product page, Value Research: UTI Nifty 50 Index Fund — Direct Plan, UTI Nifty 50 ETF fact sheet data, Nifty 50 two-year performance analysis. Fee and return figures cited are as published by the respective fund houses/issuers as of September 2026 and are subject to change — verify current figures before investing.